Academic Integrity Notice
Source code, trained model weights, and the clinical CT dataset are kept private in compliance with the University of Manchester's academic integrity policy and patient data confidentiality requirements. The full thesis report is available below.
Abstract
Takotsubo Syndrome (TTS), often called “broken-heart syndrome,” is an acute cardiac condition that mimics a heart attack without blocked arteries. Its subtle presentation leads to frequent misdiagnosis as an acute coronary event, with serious consequences for patient treatment. This project applies machine learning to routine chest CT scans — an imaging modality not previously used for TTS detection — to improve early identification of the condition. A pipeline was built that automatically segments the heart region from DICOM files using TotalSegmentator, then feeds the 3D volume into a custom 3D Convolutional Neural Network fused with patient metadata (age and sex) for binary classification. Despite a relatively small training set, the model achieved 96.2% accuracy and an AUC of 0.96 — with 100% sensitivity, catching every single TTS case in the test set. Grad-CAM explainability maps confirm the model correctly focuses on the apical region of the left ventricle, consistent with the known clinical signature of apical ballooning.
Takotsubo Syndrome mimics a heart attack in clinical presentations (ECG, blood markers, chest pain) but does not involve coronary occlusion. Rapid and automated differentiation is vital, yet radiologists lack 3D volumetric deep learning classifiers that explain their predictions.
Leveraged a clinical protocol dataset of high-resolution 3D CT scans. Built a customized 3D ResNet backbone capable of digesting spatial-temporal volumes. Engineered custom attribution maps (Grad-CAM and volumetric SHAP) to highlight the specific myocardial segments showing transient apical ballooning.
96.2% accuracy and AUC of 0.96 on the held-out test set. Critically, the model achieved 100% sensitivity — catching every single TTS case with zero missed diagnoses. Only one false positive in 26 test patients. Grad-CAM confirmed the model focuses on the apical region of the left ventricle, consistent with clinical knowledge of apical ballooning.
What the Model Sees
The characteristic shape of Takotsubo Syndrome is visible in CT: the apex of the left ventricle dilates while the base remains hypercontractile — a pattern called apical ballooning. This is what the 3D CNN learns to detect volumetrically across the full cardiac geometry.
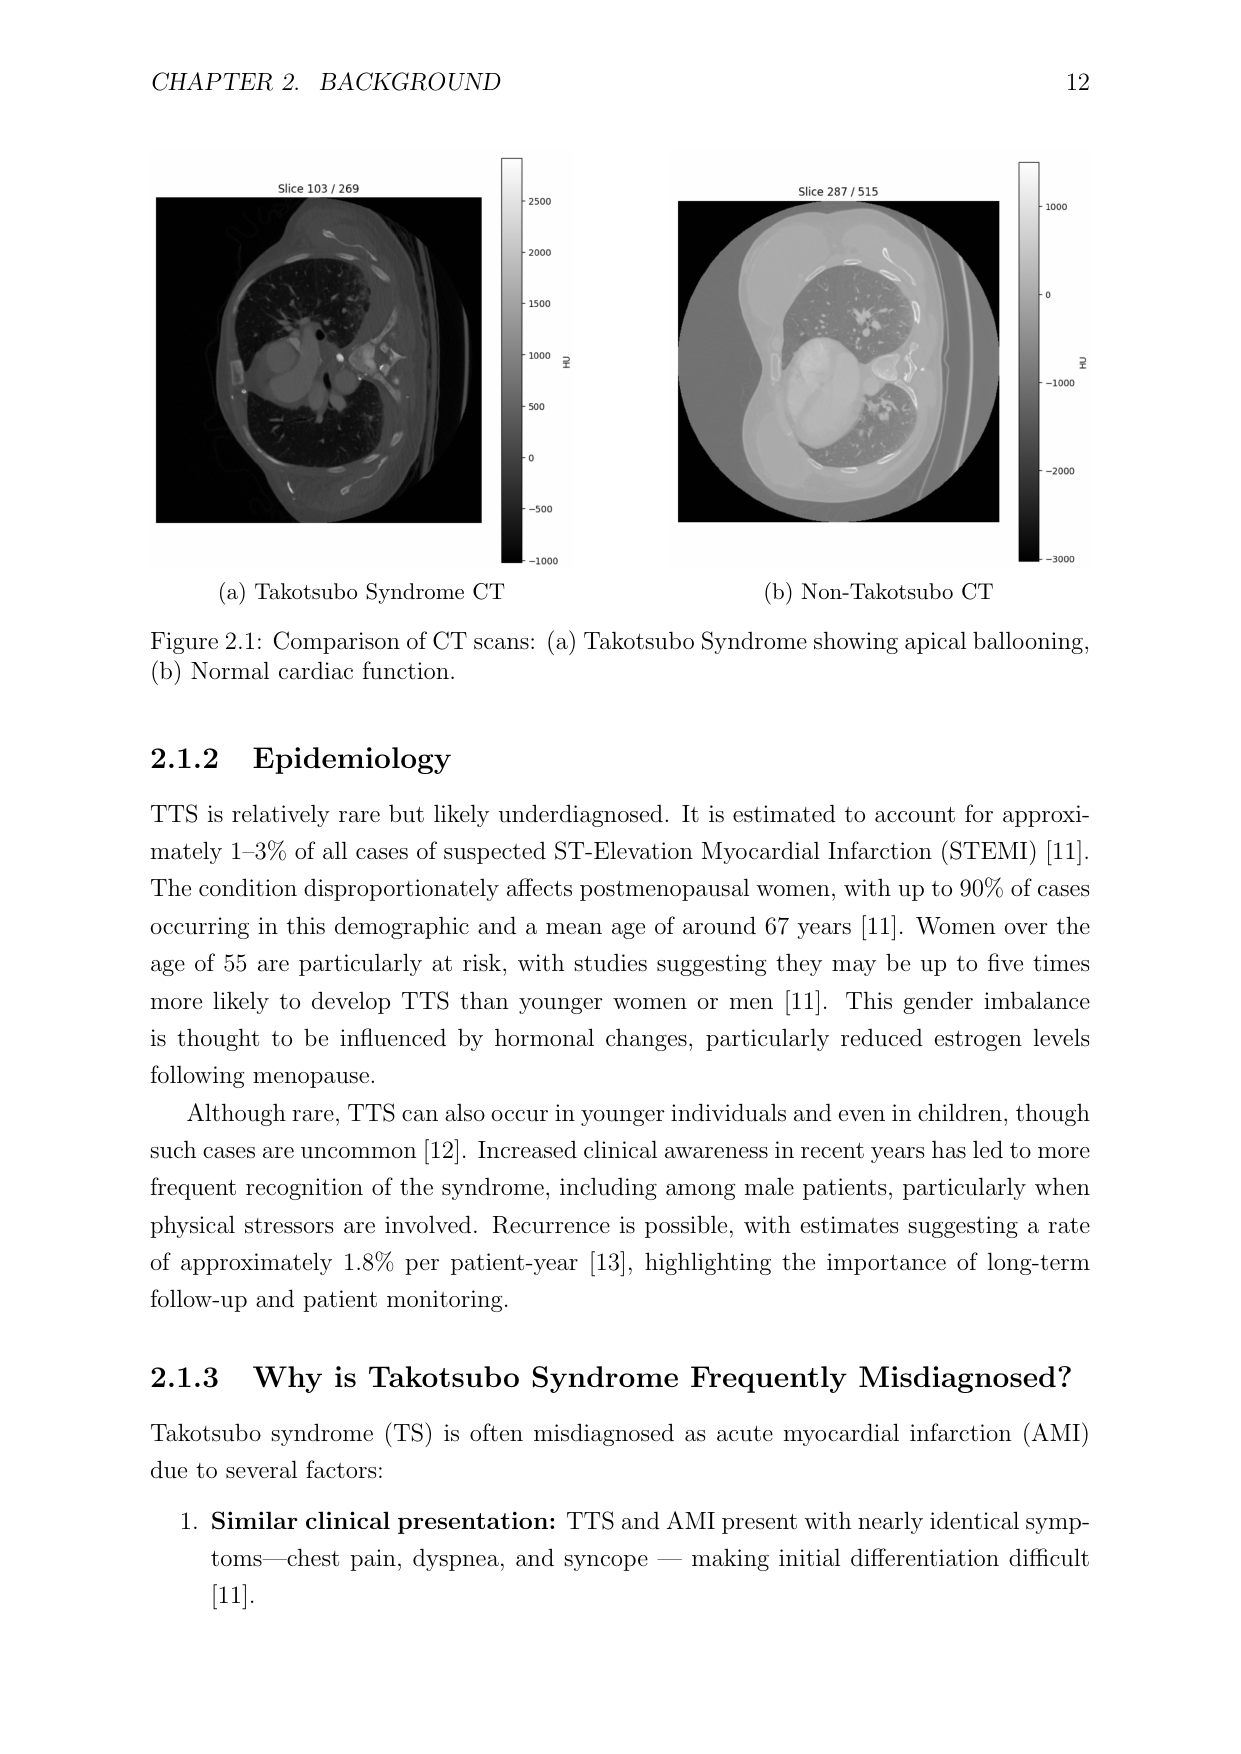
Figure 2.1 — CT scans side by side: (a) Takotsubo Syndrome showing apical ballooning, (b) normal cardiac function. The apical region of the left ventricle is visibly dilated in the TTS case.
3D CNN Architecture
The model combines a 3D convolutional feature extractor operating on the segmented heart volume (64×64×64 voxels) with a separate metadata branch processing age and sex. Both streams are fused before the final sigmoid classification output. 3D convolutions — as opposed to slice-by-slice 2D approaches — capture the full volumetric geometry of the ventricle, which is essential for detecting the shape anomaly of apical ballooning.
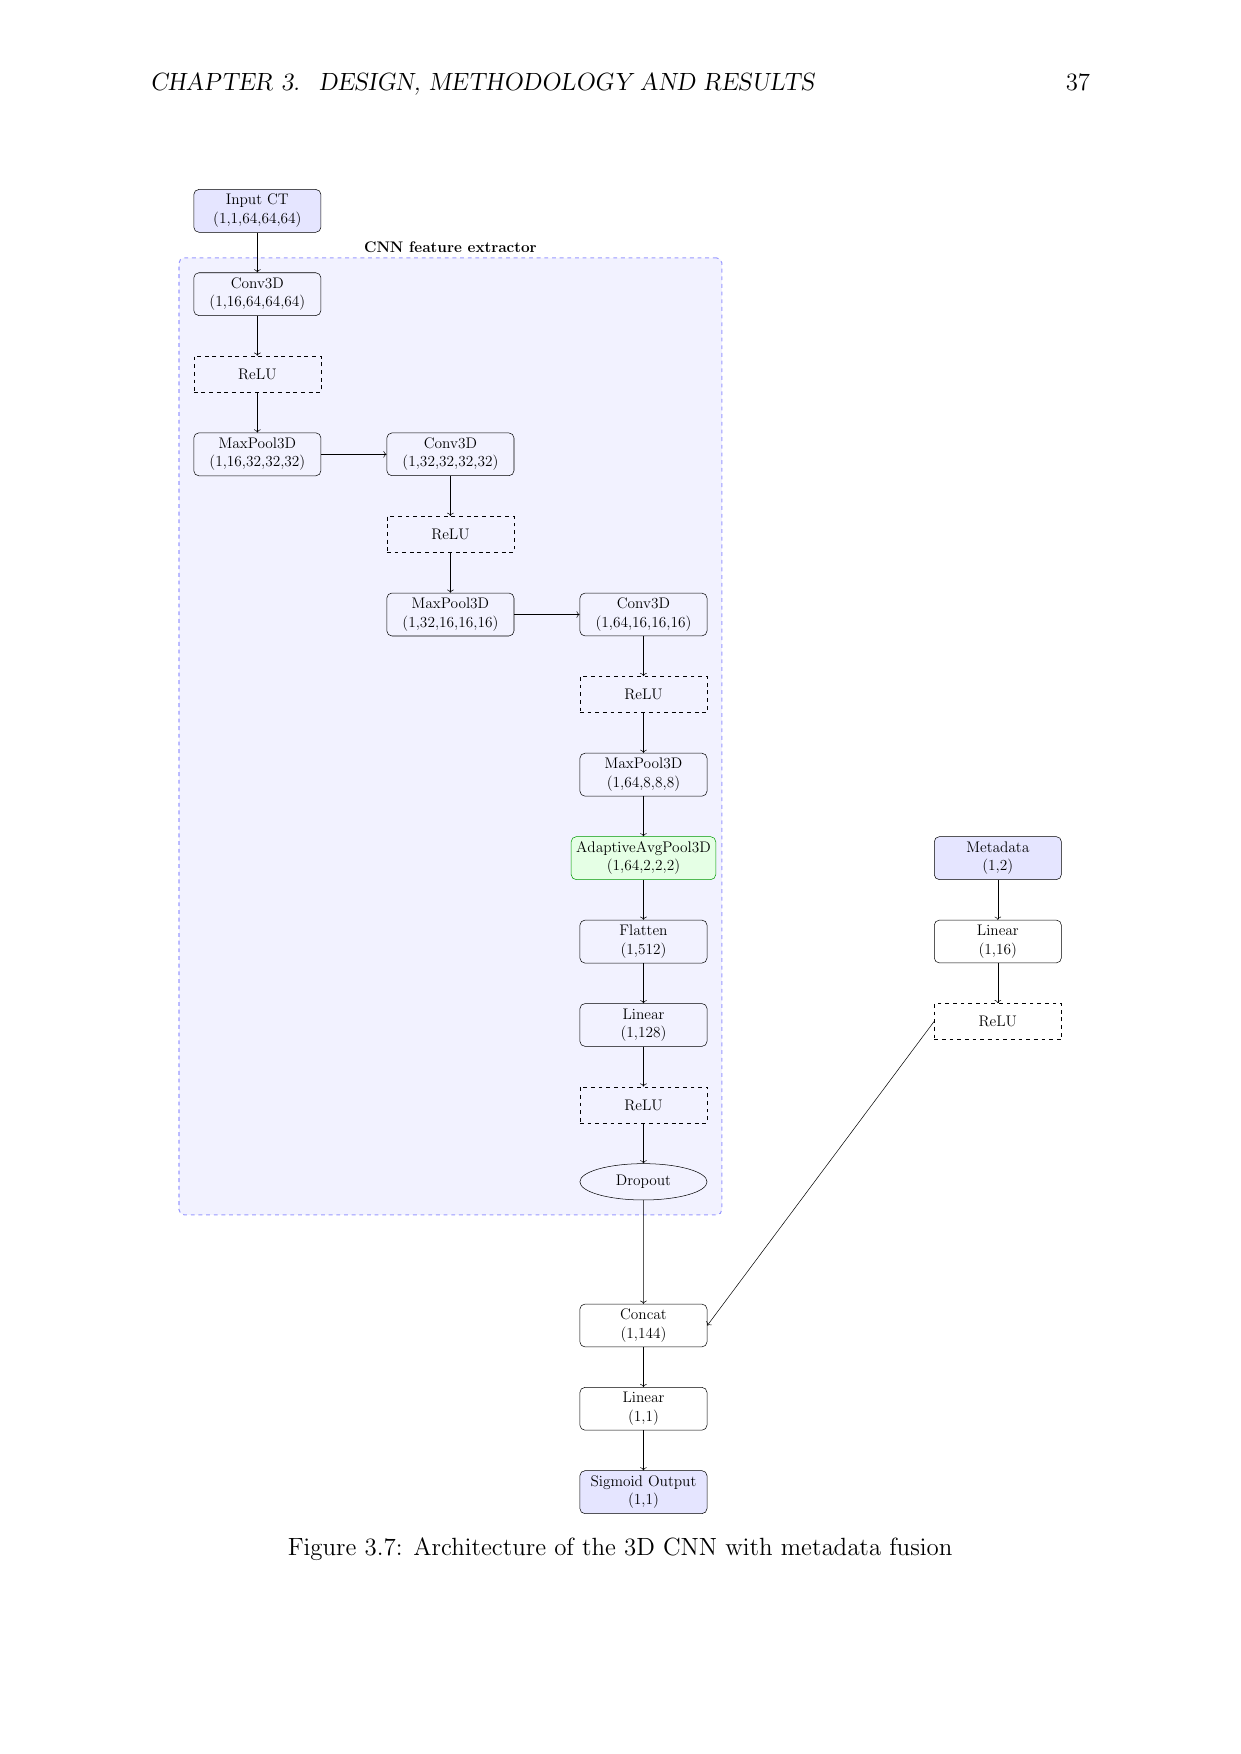
Figure 3.7 — Architecture of the 3D CNN with metadata fusion. The imaging branch uses three Conv3D + MaxPool3D blocks, flattened and fused with a 16-D metadata embedding before the final classification layer.
Results
Evaluated on a held-out test set of 26 patients, the model demonstrated strong diagnostic performance. Most critically, it achieved 100% sensitivity — every TTS patient was correctly identified. The single error was one false positive: a normal patient classified as TTS.
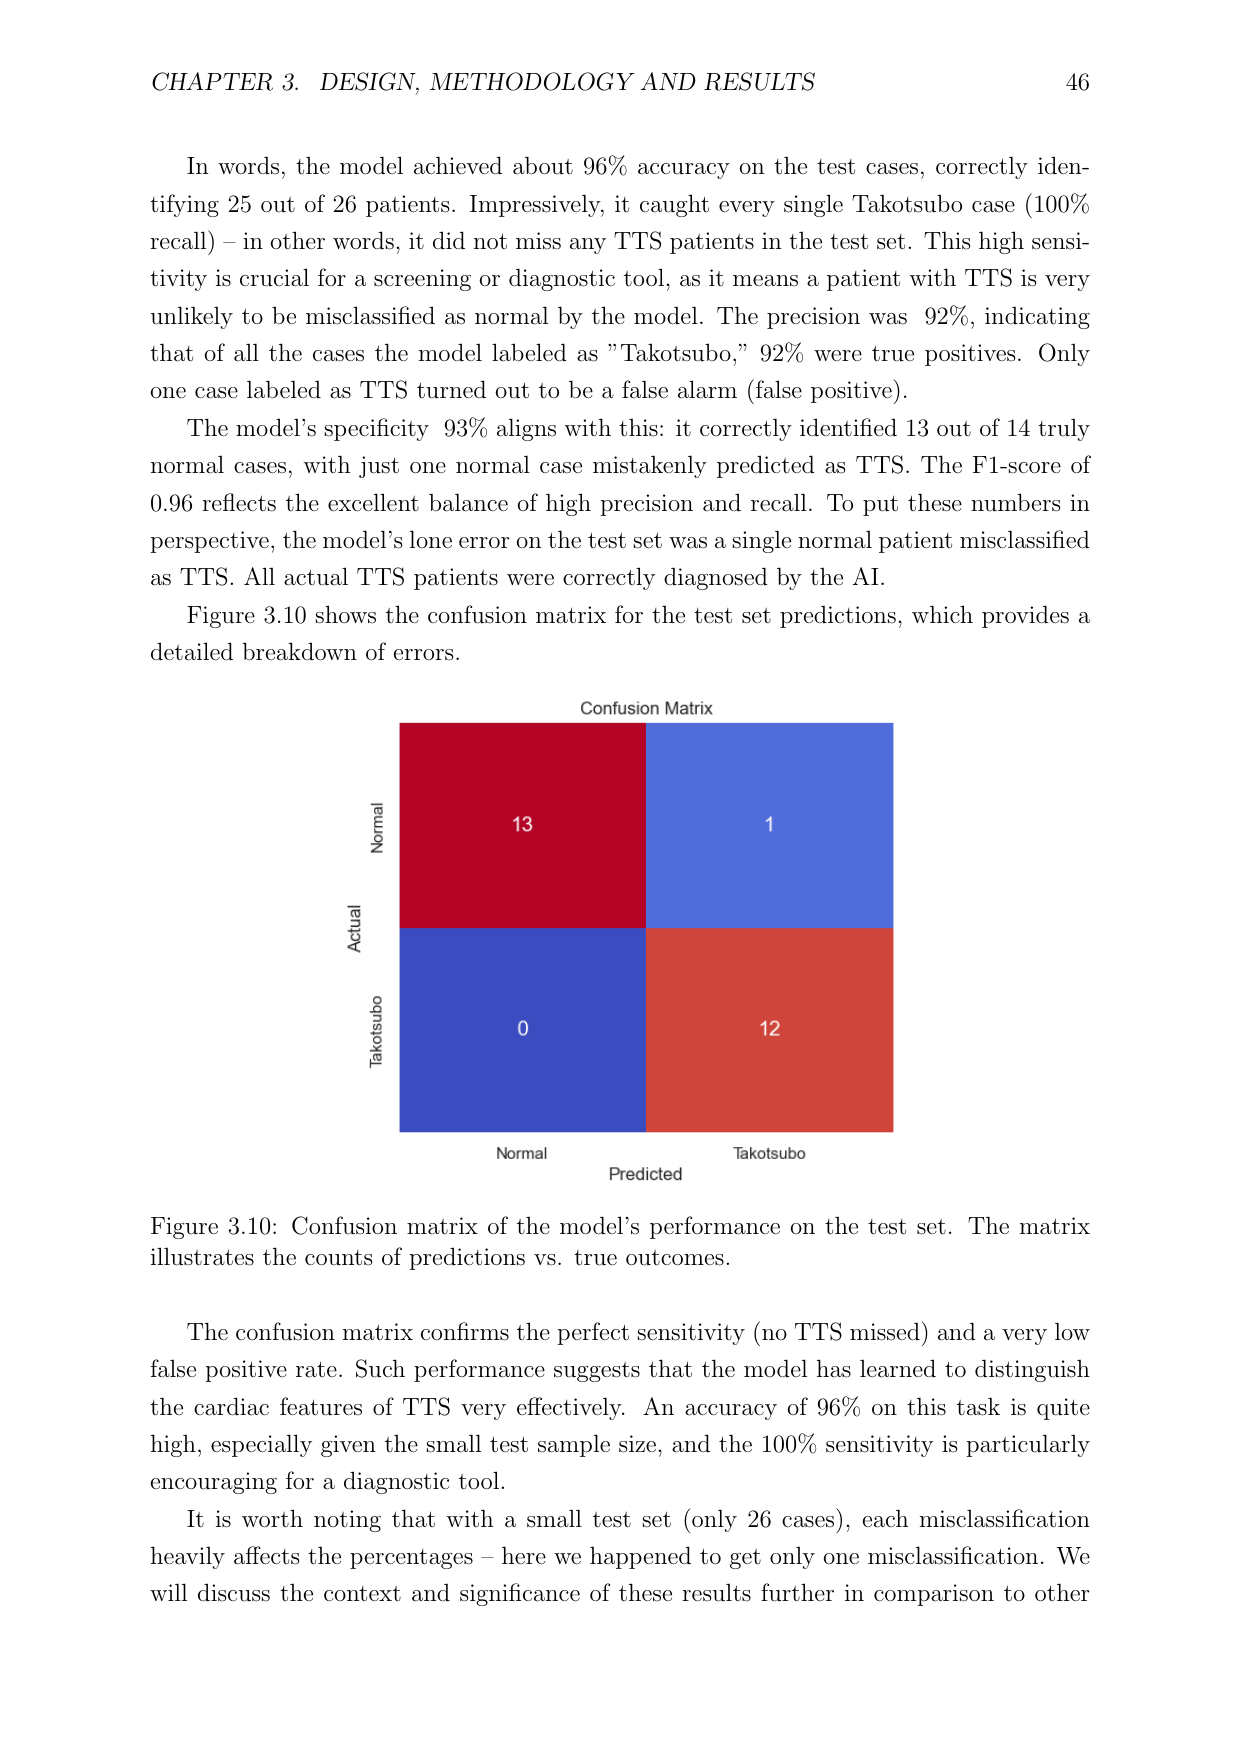
Figure 3.10 — Confusion matrix. 25 of 26 test patients correctly classified. All 12 TTS patients identified; 1 normal patient misclassified as TTS.
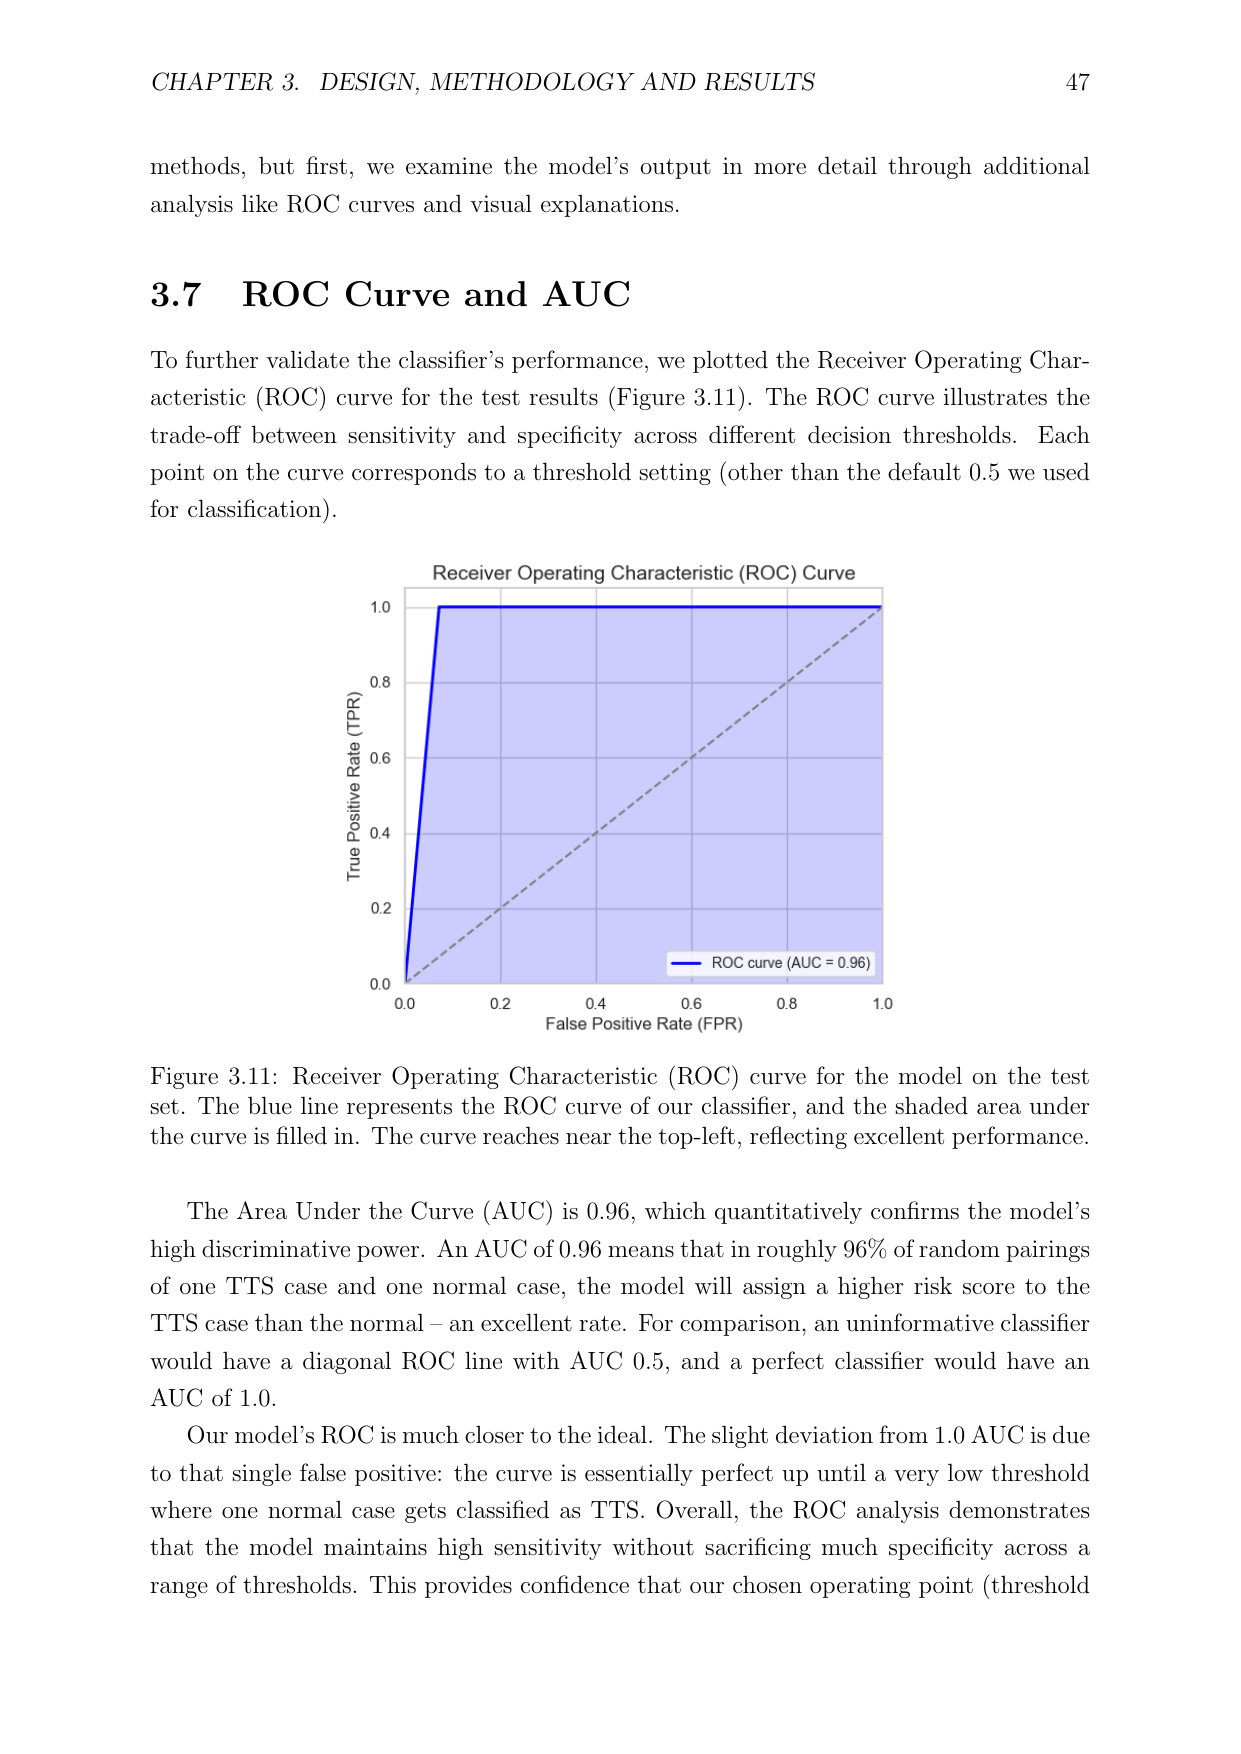
Figure 3.11 — ROC curve on the test set. AUC of 0.96, reaching near the top-left corner and reflecting excellent discriminative performance.
Explainability — Grad-CAM
To validate that the model learns clinically meaningful features, Grad-CAM attribution maps were generated on test predictions. The heatmaps consistently highlight the apical region of the left ventricle — precisely the region that balloons outward in TTS. This confirms the model is not exploiting spurious artefacts but genuinely detecting the anatomical signature clinicians look for.
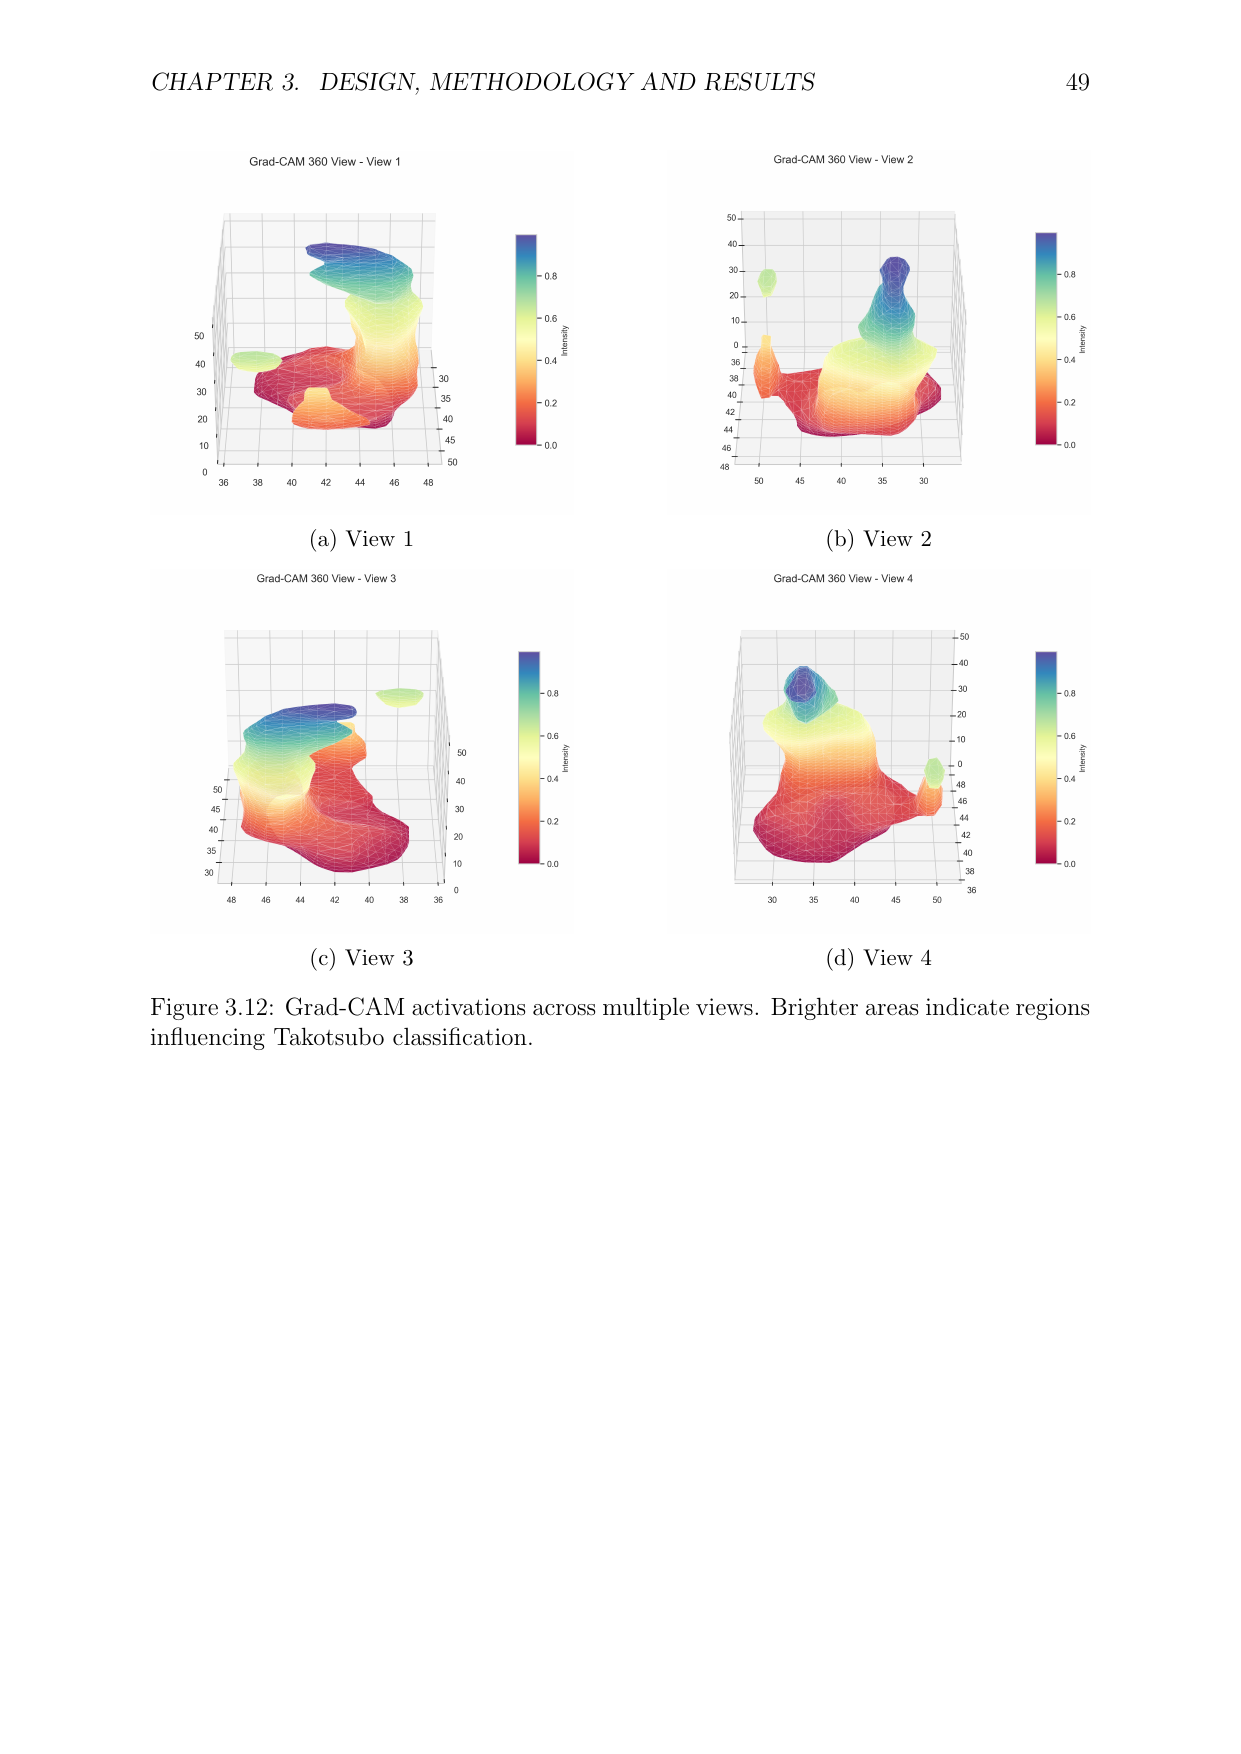
Figure 3.12 — Grad-CAM activations across four 360° views of the segmented heart. Brighter (yellow/white) regions have the strongest influence on the TTS classification. The apex of the left ventricle is consistently the most activated region.
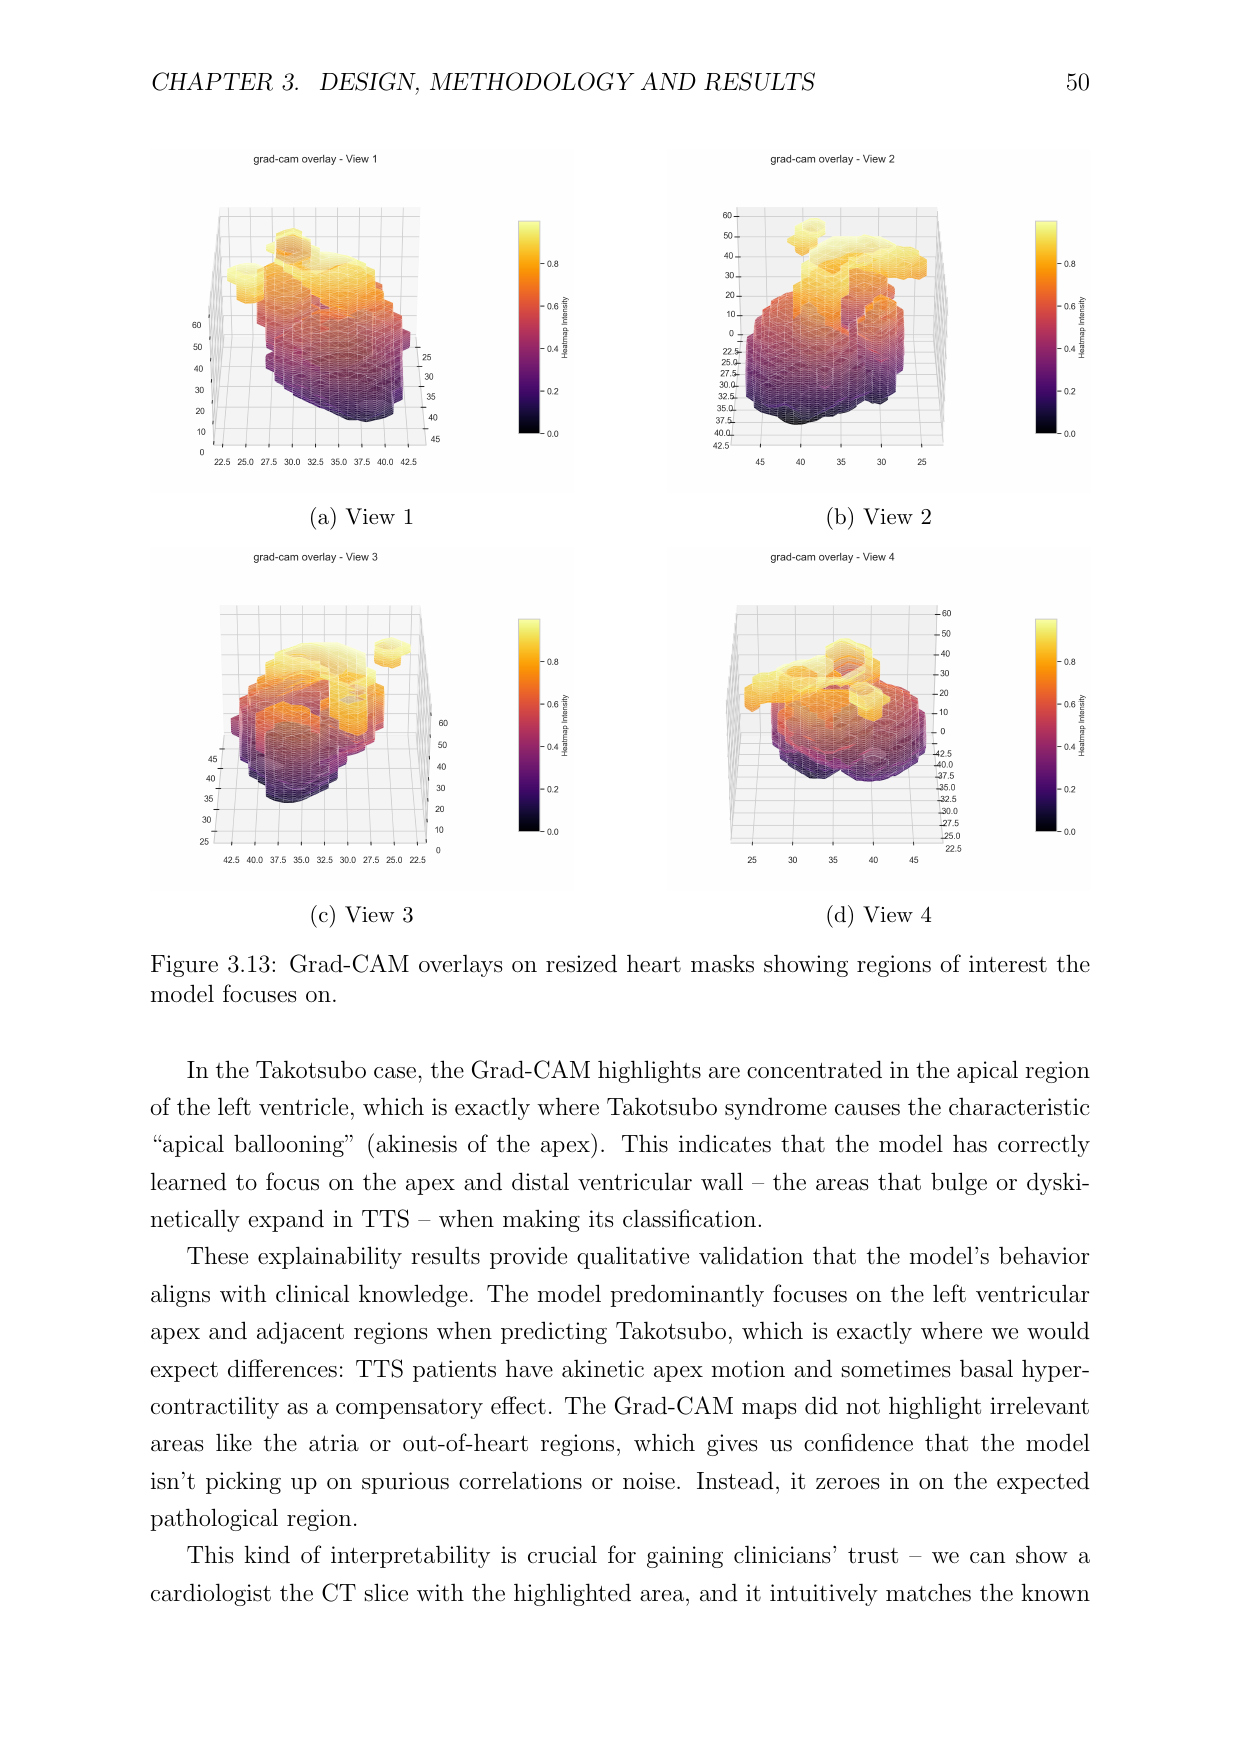
Figure 3.13 — Grad-CAM overlaid directly on the resized heart mask slices, showing the specific voxel regions the model focuses on during Takotsubo classification.
Full Thesis Report
The complete 12,683-word thesis — covering background, clinical context, methodology, results, and future work — is available to read below.